Graphs are updated hourly.
Quick notes:- "Confused" means that dual stack succeeded on both IPv4 and IPv6 - when it should have only worked on one. Browser shenanigans suspected.
- Web Filter means that both the "A" and "AAAA" test failed. More browser (plugin/filter) shenanigans.
- Brokeness goes down, when volume goes up. Means we have a wider sample audience, instead of people who believe they are broken (or are testing their new tunnels).
These graphs show the last 60 days of activity at test-ipv6.com
Graph: shows result summaries, stacked. Total height shows number of users who took the test on a given day.
Similiar graph, except this time showing percentages.
The most interesting graph is the percentage of "broken" users. Our definition of a "broken" user is that the
browser stalls or times out, while attempting to visit a web site published on both IPv4 and IPv6.
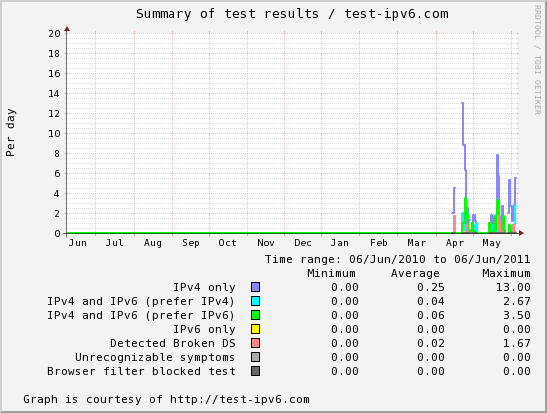
Line graph, not stacked, of results over time.
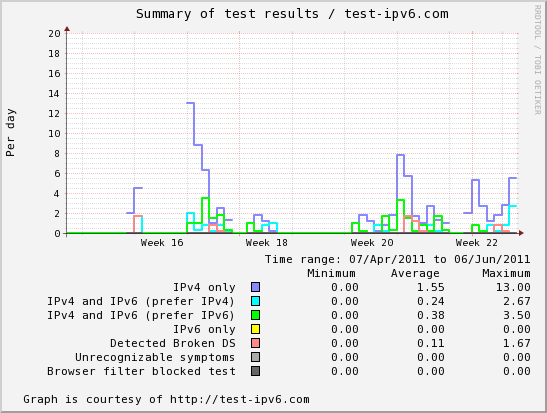
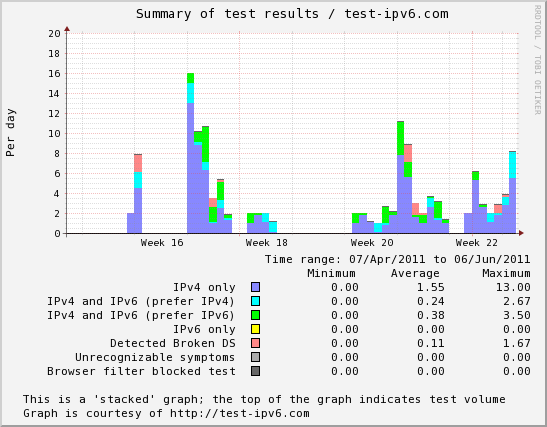
These graphs show the last year of activity at test-ipv6.com
Graph: shows result summaries, stacked. Total height shows number of users who took the test on a given day.
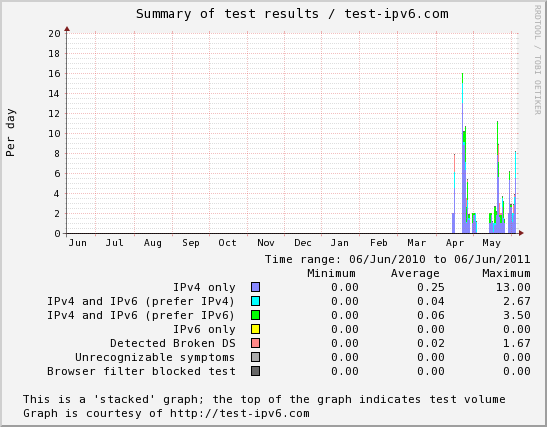
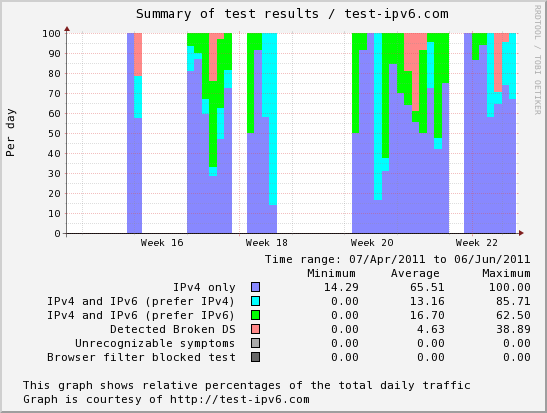
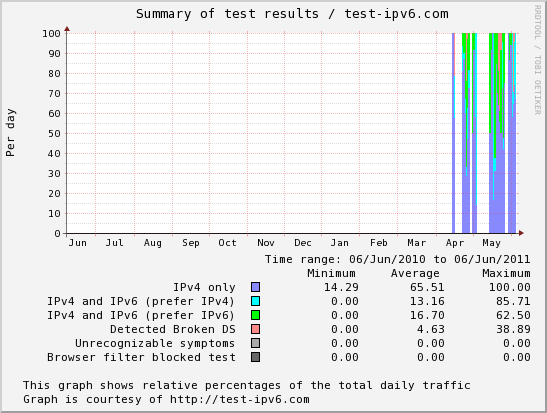
Similiar graph, except this time showing percentages.
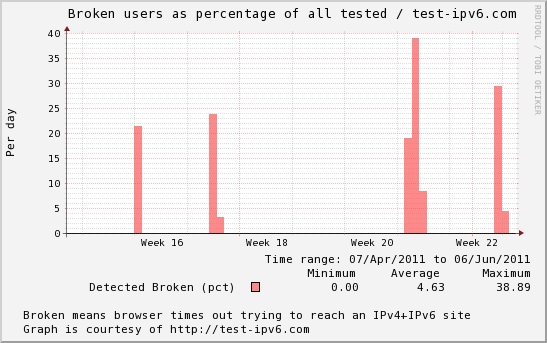
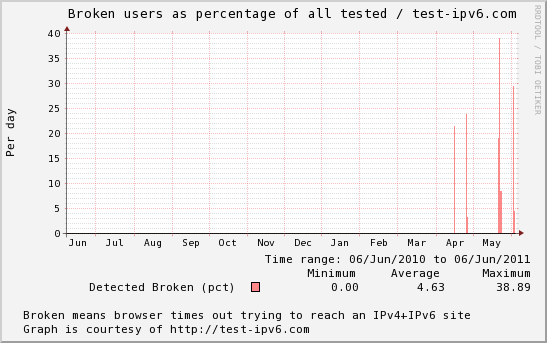
The most interesting graph is the percentage of "broken" users. Our definition of a "broken" user is that the
browser stalls or times out, while attempting to visit a web site published on both IPv4 and IPv6.
Line graph, not stacked, of results over time.